2024
Enterprise Sales & Ops Reporting
Unlocking Performance Through Unified Data and Real-Time Insights
Know More
I design and lead reporting solutions that simplify complex data into clear, actionable insights, helping businesses and field teams make faster, smarter decisions.
A Perfect Blend of Elegance and Functionality
From real-time performance tracking to intuitive dashboards, every detail is crafted to enhance productivity and empower users at all levels—driving both operational efficiency and revenue growth. This platform consolidated data from multiple systems into a single source of truth, delivering real-time KPIs and automated reporting that transformed sales performance across regions.
Problem
Field teams, sales representatives, managers, C-suite struggled with outdated reporting systems, limiting performance visibility and hindering productivity. Manual data pulls were error-prone and time-consuming, and inconsistent KPIs across regions hampered optimization. Leadership lacked comprehensive metrics, impacting strategic growth.
I collaborated with cross-functional teams, including sales, field operations, and headquarters, to ensure the platform met the diverse needs of all stakeholders. Leading analytics for the service sales portfolio, which represents the company’s core revenue stream, I ensured that both sales leader/ executives and sales reps had a unified, standardized view of performance metrics.
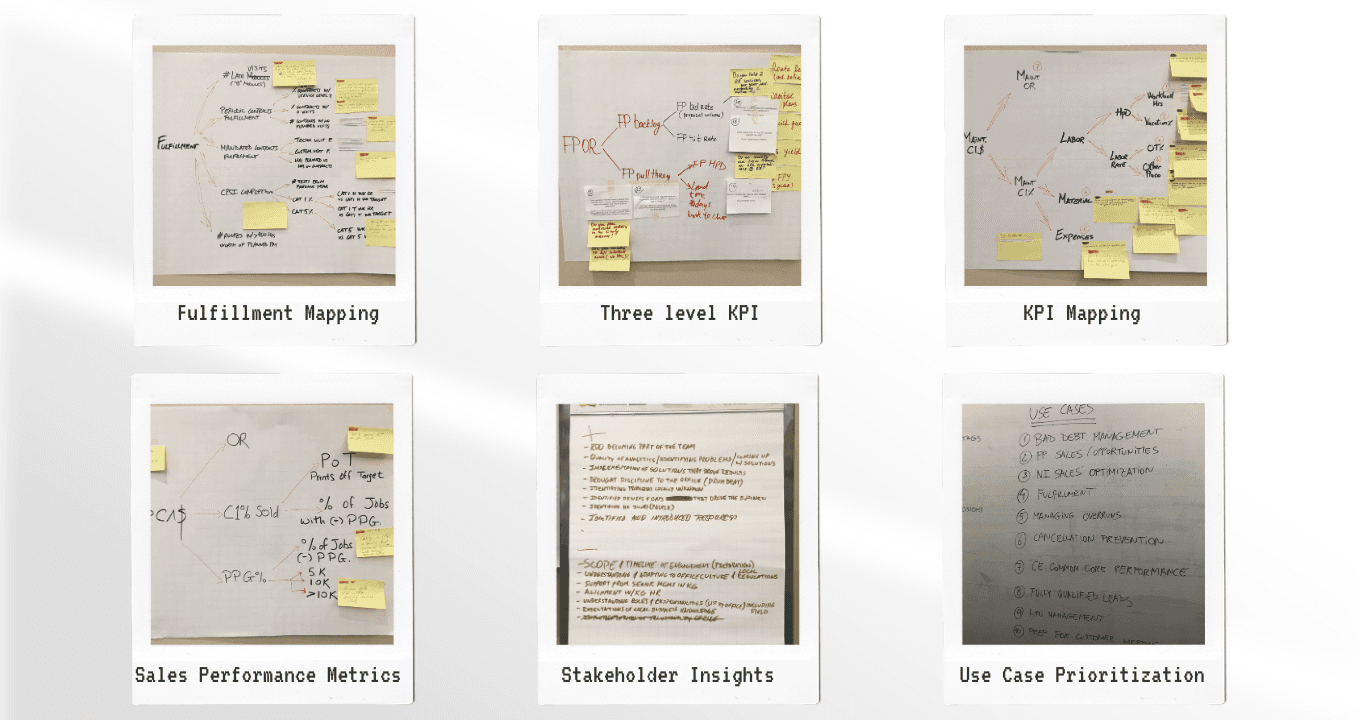
Through user research and empathy-driven workshops, I captured the real-world challenges faced by sales reps and managers. After drafting initial concepts on paper, I collaborated closely with the data and IT team to refine the design and ensure the platform’s architecture aligned with user needs.


Solution
I spearheaded the development of a unified analytics platform providing a standardized, real-time KPI's, dashboards and interactive reports tailored to the needs of sales reps, district managers, and executive leadership.
Key Features:
Real-Time Dashboards: Customizable dashboards with real-time KPIs such as bookings-to-plan, proposal success rates, churn, and labor efficiency.
Intuitive Navigation: Seamless navigation between dashboards, with context-preserving filters and drill-down capabilities.
Advanced Filtering: Standardized filters with default selections based on user roles and regions, ensuring quick access to relevant data.
Data Drill-Down: Ability to drill down from high-level KPIs to detailed sales transactions, work orders, and labor costs.
Performance Tracking: Automated tracking of sales performance against district and national targets.
Responsive Design: Optimized for both desktop and mobile devices, ensuring accessibility in the field.
Why These KPIs?
Each KPI was selected based on its direct impact on sales performance and operational efficiency:
Bookings-to-Plan: Tracks actual bookings against sales targets, providing insights into performance trends.
Proposal Success Rate: Measures the percentage of proposals that convert into sales, identifying areas for improvement.
Churn Rate: Monitors customer cancellations to identify retention challenges.
Labor Efficiency: Tracks labor hours and productivity, ensuring optimal resource utilization.
Revenue by Product Line: Provides insights into the performance of different service offerings.
Bid Performance: Analyzes bid success rates and pipeline performance, ensuring a healthy sales funnel.
User Workflow Example:
A district manager logs in and sees a dashboard summarizing key KPIs for their region.
They drill down into the bookings-to-plan metric to identify underperforming sales reps.
Using the proposal success rate dashboard, they identify areas where sales proposals need improvement.
Finally, they review the labor efficiency dashboard to ensure that operational costs are aligned with revenue targets.
To drive adoption and maximize the platform’s impact, I led comprehensive training sessions for sales reps, district managers, and headquarters teams. These sessions focused on interpreting key KPIs, using advanced filtering options, and leveraging drill-down capabilities to make informed decisions. By automating manual reporting processes, the platform eliminated the need for dedicated reporting analysts, saving significant costs that could be reallocated to strategic initiatives.
Implementation
Implementation
By combining advanced data analytics with intuitive user interfaces, I have empowered sales teams, district managers, and executives to make data-driven decisions that drive growth and optimize performance.
Design Principles
The design of the platform was guided by three core principles:
User-Centered Design: Intuitive interfaces and seamless navigation ensure that users can access insights quickly and easily.
Visual Clarity: Consistent color coding and visually engaging charts highlight key trends and outliers.
Scalability: The platform is designed to scale with the organization, supporting additional data sources and user groups as needed.
Color Coding and Design Language
Green: Indicates performance above target.
Yellow: Signals areas requiring attention.
Red: Highlights critical performance gaps.
Neutral Grey: Represents non-actionable data points, maintaining focus on key metrics.
Data Architecture
The platform integrates data from multiple systems, ensuring accurate and timely insights:
Data Sources: CADRE for sales estimates, Lotus Notes for proposal and Customer information, SAP for financial information, and Excel for manual adjustments.
ETL Process: Automated ETL pipelines extract, transform, and load data into the BI platform, ensuring data accuracy and consistency.
Data Refresh Rates: Daily data refresh ensures that users have access to the latest information.
Data Structure and Relationships
Single Source of Truth: The platform integrates data from Bidding Tool, SAP, Lotus Notes, and SHAPE (Global SAP system) into a centralized data warehouse.
Organizational Norms (ON): Data logic follows standard organizational KPIs and calculation methodologies to ensure consistency.
ETL Process: Automated Extract-Transform-Load (ETL) pipelines clean and normalize data before loading it into the BI platform.
Table Relationships:
Sales Rep IDandDistrict IDestablish relationships between performance data and organizational hierarchy.Work Order IDconnects service performance metrics with financial data.Booking Amount,Labor Hours, andRevenueare aggregated at daily, monthly, and quarterly levels for trend analysis.
Impact and Results
The implementation of the Portfolio Insights & Performance Analytics Platform has delivered measurable improvements across the organization:
Increased Sales Performance: Sales teams now have real-time insights into their performance, enabling proactive course corrections.
Enhanced Decision-Making: District managers can quickly identify performance gaps and address them before they impact revenue.
Operational Efficiency: Automated reporting has eliminated manual processes, saving time and reducing errors.
Data-Driven Culture: The platform has fostered a culture of data-driven decision-making, aligning sales and operations with organizational goals.
This project highlights my ability to design and lead sophisticated BI solutions that deliver real business value. This platform is a testament to my expertise in Business Intelligence (BI) & Reporting, Business Process Integration (BPiM), and , Product Management and I am excited to bring this level of innovation to future projects.
Field Name | Description | Source System | Data Type | Logic/Transformation |
|---|---|---|---|---|
Sales Rep ID | Unique identifier for each sales representative | Bidding Tool | Integer | Used as a primary key for sales performance tracking |
District ID | Identifier for each sales district | Bidding Tool | Integer | Used to aggregate data at the district level |
Booking Amount | Total value of sales bookings | Lotus Notes | Currency | Summation of bookings YTD |
Bookings-to-Plan (%) | Percentage of actual bookings against planned targets | Bidding Tool, Lotus Notes | Percentage |
|
Proposal Success Rate (%) | Ratio of successful sales proposals to total proposals | Bidding Tool | Percentage |
|
Churn Rate (%) | Percentage of customers who canceled services | SAP | Percentage |
|
Labor Hours (Actual) | Total hours worked by field technicians | SAP | Decimal | Aggregated at the monthly level |
Labor Efficiency (%) | Productivity measure comparing actual hours to planned hours | SAP | Percentage |
|
Revenue by Product Line | Revenue generated from each product/service category | Lotus Notes | Currency | Aggregated at product line level |
Bid Performance (%) | Ratio of bids won to total bids submitted | Bidding Tool, Lotus Notes | Percentage |
|
Overruns ($) | Total cost overruns for completed jobs | SAP | Currency | Sum of cost overruns YTD |
Competitor Loss Analysis | Number of lost deals with reasons specified | SHAPE | Integer | Categorized by loss reason |
Sweet Spot Analysis (Units) | Optimal number of units for maximizing profitability | Bidding Tool | Integer | Calculated based on historical performance |
Work Order ID | Unique identifier for each service work order | SAP | Integer | Used for detailed drill-down analysis |
Refresh Rate | Frequency of data refresh for real-time insights | ETL Process | Timestamp | Daily refresh scheduled at midnight |

More Works
More Works


FAQ
FAQ
01
What's your approach to turning complex business challenges into actionable solutions?
02
How do you balance innovation with practical implementation?
03
How do you ensure cross-functional alignment in large-scale projects?
04
What's your strategy for driving data-informed decision making?
05
How do you approach change management in global teams?
06
How do you measure and communicate the impact of your initiatives?
07
How do you balance technical solutions with business needs?
08
What's your philosophy on continuous improvement and learning?
2024
Enterprise Sales & Ops Reporting
Unlocking Performance Through Unified Data and Real-Time Insights
Know More
I design and lead reporting solutions that simplify complex data into clear, actionable insights, helping businesses and field teams make faster, smarter decisions.
A Perfect Blend of Elegance and Functionality
From real-time performance tracking to intuitive dashboards, every detail is crafted to enhance productivity and empower users at all levels—driving both operational efficiency and revenue growth. This platform consolidated data from multiple systems into a single source of truth, delivering real-time KPIs and automated reporting that transformed sales performance across regions.
Problem
Field teams, sales representatives, managers, C-suite struggled with outdated reporting systems, limiting performance visibility and hindering productivity. Manual data pulls were error-prone and time-consuming, and inconsistent KPIs across regions hampered optimization. Leadership lacked comprehensive metrics, impacting strategic growth.
I collaborated with cross-functional teams, including sales, field operations, and headquarters, to ensure the platform met the diverse needs of all stakeholders. Leading analytics for the service sales portfolio, which represents the company’s core revenue stream, I ensured that both sales leader/ executives and sales reps had a unified, standardized view of performance metrics.
Through user research and empathy-driven workshops, I captured the real-world challenges faced by sales reps and managers. After drafting initial concepts on paper, I collaborated closely with the data and IT team to refine the design and ensure the platform’s architecture aligned with user needs.
Solution
I spearheaded the development of a unified analytics platform providing a standardized, real-time KPI's, dashboards and interactive reports tailored to the needs of sales reps, district managers, and executive leadership.
Key Features:
Real-Time Dashboards: Customizable dashboards with real-time KPIs such as bookings-to-plan, proposal success rates, churn, and labor efficiency.
Intuitive Navigation: Seamless navigation between dashboards, with context-preserving filters and drill-down capabilities.
Advanced Filtering: Standardized filters with default selections based on user roles and regions, ensuring quick access to relevant data.
Data Drill-Down: Ability to drill down from high-level KPIs to detailed sales transactions, work orders, and labor costs.
Performance Tracking: Automated tracking of sales performance against district and national targets.
Responsive Design: Optimized for both desktop and mobile devices, ensuring accessibility in the field.
Why These KPIs?
Each KPI was selected based on its direct impact on sales performance and operational efficiency:
Bookings-to-Plan: Tracks actual bookings against sales targets, providing insights into performance trends.
Proposal Success Rate: Measures the percentage of proposals that convert into sales, identifying areas for improvement.
Churn Rate: Monitors customer cancellations to identify retention challenges.
Labor Efficiency: Tracks labor hours and productivity, ensuring optimal resource utilization.
Revenue by Product Line: Provides insights into the performance of different service offerings.
Bid Performance: Analyzes bid success rates and pipeline performance, ensuring a healthy sales funnel.
User Workflow Example:
A district manager logs in and sees a dashboard summarizing key KPIs for their region.
They drill down into the bookings-to-plan metric to identify underperforming sales reps.
Using the proposal success rate dashboard, they identify areas where sales proposals need improvement.
Finally, they review the labor efficiency dashboard to ensure that operational costs are aligned with revenue targets.
To drive adoption and maximize the platform’s impact, I led comprehensive training sessions for sales reps, district managers, and headquarters teams. These sessions focused on interpreting key KPIs, using advanced filtering options, and leveraging drill-down capabilities to make informed decisions. By automating manual reporting processes, the platform eliminated the need for dedicated reporting analysts, saving significant costs that could be reallocated to strategic initiatives.
Implementation
By combining advanced data analytics with intuitive user interfaces, I have empowered sales teams, district managers, and executives to make data-driven decisions that drive growth and optimize performance.
Design Principles
The design of the platform was guided by three core principles:
User-Centered Design: Intuitive interfaces and seamless navigation ensure that users can access insights quickly and easily.
Visual Clarity: Consistent color coding and visually engaging charts highlight key trends and outliers.
Scalability: The platform is designed to scale with the organization, supporting additional data sources and user groups as needed.
Color Coding and Design Language
Green: Indicates performance above target.
Yellow: Signals areas requiring attention.
Red: Highlights critical performance gaps.
Neutral Grey: Represents non-actionable data points, maintaining focus on key metrics.
Data Architecture
The platform integrates data from multiple systems, ensuring accurate and timely insights:
Data Sources: CADRE for sales estimates, Lotus Notes for proposal and Customer information, SAP for financial information, and Excel for manual adjustments.
ETL Process: Automated ETL pipelines extract, transform, and load data into the BI platform, ensuring data accuracy and consistency.
Data Refresh Rates: Daily data refresh ensures that users have access to the latest information.
Data Structure and Relationships
Single Source of Truth: The platform integrates data from Bidding Tool, SAP, Lotus Notes, and SHAPE (Global SAP system) into a centralized data warehouse.
Organizational Norms (ON): Data logic follows standard organizational KPIs and calculation methodologies to ensure consistency.
ETL Process: Automated Extract-Transform-Load (ETL) pipelines clean and normalize data before loading it into the BI platform.
Table Relationships:
Sales Rep IDandDistrict IDestablish relationships between performance data and organizational hierarchy.Work Order IDconnects service performance metrics with financial data.Booking Amount,Labor Hours, andRevenueare aggregated at daily, monthly, and quarterly levels for trend analysis.
Impact and Results
The implementation of the Portfolio Insights & Performance Analytics Platform has delivered measurable improvements across the organization:
Increased Sales Performance: Sales teams now have real-time insights into their performance, enabling proactive course corrections.
Enhanced Decision-Making: District managers can quickly identify performance gaps and address them before they impact revenue.
Operational Efficiency: Automated reporting has eliminated manual processes, saving time and reducing errors.
Data-Driven Culture: The platform has fostered a culture of data-driven decision-making, aligning sales and operations with organizational goals.
This project highlights my ability to design and lead sophisticated BI solutions that deliver real business value. This platform is a testament to my expertise in Business Intelligence (BI) & Reporting, Business Process Integration (BPiM), and , Product Management and I am excited to bring this level of innovation to future projects.
Field Name | Description | Source System | Data Type | Logic/Transformation |
|---|---|---|---|---|
Sales Rep ID | Unique identifier for each sales representative | Bidding Tool | Integer | Used as a primary key for sales performance tracking |
District ID | Identifier for each sales district | Bidding Tool | Integer | Used to aggregate data at the district level |
Booking Amount | Total value of sales bookings | Lotus Notes | Currency | Summation of bookings YTD |
Bookings-to-Plan (%) | Percentage of actual bookings against planned targets | Bidding Tool, Lotus Notes | Percentage |
|
Proposal Success Rate (%) | Ratio of successful sales proposals to total proposals | Bidding Tool | Percentage |
|
Churn Rate (%) | Percentage of customers who canceled services | SAP | Percentage |
|
Labor Hours (Actual) | Total hours worked by field technicians | SAP | Decimal | Aggregated at the monthly level |
Labor Efficiency (%) | Productivity measure comparing actual hours to planned hours | SAP | Percentage |
|
Revenue by Product Line | Revenue generated from each product/service category | Lotus Notes | Currency | Aggregated at product line level |
Bid Performance (%) | Ratio of bids won to total bids submitted | Bidding Tool, Lotus Notes | Percentage |
|
Overruns ($) | Total cost overruns for completed jobs | SAP | Currency | Sum of cost overruns YTD |
Competitor Loss Analysis | Number of lost deals with reasons specified | SHAPE | Integer | Categorized by loss reason |
Sweet Spot Analysis (Units) | Optimal number of units for maximizing profitability | Bidding Tool | Integer | Calculated based on historical performance |
Work Order ID | Unique identifier for each service work order | SAP | Integer | Used for detailed drill-down analysis |
Refresh Rate | Frequency of data refresh for real-time insights | ETL Process | Timestamp | Daily refresh scheduled at midnight |
More Works
FAQ
01
What's your approach to turning complex business challenges into actionable solutions?
02
How do you balance innovation with practical implementation?
03
How do you ensure cross-functional alignment in large-scale projects?
04
What's your strategy for driving data-informed decision making?
05
How do you approach change management in global teams?
06
How do you measure and communicate the impact of your initiatives?
07
How do you balance technical solutions with business needs?
08
What's your philosophy on continuous improvement and learning?
2024
Enterprise Sales & Ops Reporting
Unlocking Performance Through Unified Data and Real-Time Insights
Know More
I design and lead reporting solutions that simplify complex data into clear, actionable insights, helping businesses and field teams make faster, smarter decisions.
A Perfect Blend of Elegance and Functionality
From real-time performance tracking to intuitive dashboards, every detail is crafted to enhance productivity and empower users at all levels—driving both operational efficiency and revenue growth. This platform consolidated data from multiple systems into a single source of truth, delivering real-time KPIs and automated reporting that transformed sales performance across regions.
Problem
Field teams, sales representatives, managers, C-suite struggled with outdated reporting systems, limiting performance visibility and hindering productivity. Manual data pulls were error-prone and time-consuming, and inconsistent KPIs across regions hampered optimization. Leadership lacked comprehensive metrics, impacting strategic growth.
I collaborated with cross-functional teams, including sales, field operations, and headquarters, to ensure the platform met the diverse needs of all stakeholders. Leading analytics for the service sales portfolio, which represents the company’s core revenue stream, I ensured that both sales leader/ executives and sales reps had a unified, standardized view of performance metrics.
Through user research and empathy-driven workshops, I captured the real-world challenges faced by sales reps and managers. After drafting initial concepts on paper, I collaborated closely with the data and IT team to refine the design and ensure the platform’s architecture aligned with user needs.
Solution
I spearheaded the development of a unified analytics platform providing a standardized, real-time KPI's, dashboards and interactive reports tailored to the needs of sales reps, district managers, and executive leadership.
Key Features:
Real-Time Dashboards: Customizable dashboards with real-time KPIs such as bookings-to-plan, proposal success rates, churn, and labor efficiency.
Intuitive Navigation: Seamless navigation between dashboards, with context-preserving filters and drill-down capabilities.
Advanced Filtering: Standardized filters with default selections based on user roles and regions, ensuring quick access to relevant data.
Data Drill-Down: Ability to drill down from high-level KPIs to detailed sales transactions, work orders, and labor costs.
Performance Tracking: Automated tracking of sales performance against district and national targets.
Responsive Design: Optimized for both desktop and mobile devices, ensuring accessibility in the field.
Why These KPIs?
Each KPI was selected based on its direct impact on sales performance and operational efficiency:
Bookings-to-Plan: Tracks actual bookings against sales targets, providing insights into performance trends.
Proposal Success Rate: Measures the percentage of proposals that convert into sales, identifying areas for improvement.
Churn Rate: Monitors customer cancellations to identify retention challenges.
Labor Efficiency: Tracks labor hours and productivity, ensuring optimal resource utilization.
Revenue by Product Line: Provides insights into the performance of different service offerings.
Bid Performance: Analyzes bid success rates and pipeline performance, ensuring a healthy sales funnel.
User Workflow Example:
A district manager logs in and sees a dashboard summarizing key KPIs for their region.
They drill down into the bookings-to-plan metric to identify underperforming sales reps.
Using the proposal success rate dashboard, they identify areas where sales proposals need improvement.
Finally, they review the labor efficiency dashboard to ensure that operational costs are aligned with revenue targets.
To drive adoption and maximize the platform’s impact, I led comprehensive training sessions for sales reps, district managers, and headquarters teams. These sessions focused on interpreting key KPIs, using advanced filtering options, and leveraging drill-down capabilities to make informed decisions. By automating manual reporting processes, the platform eliminated the need for dedicated reporting analysts, saving significant costs that could be reallocated to strategic initiatives.
Implementation
By combining advanced data analytics with intuitive user interfaces, I have empowered sales teams, district managers, and executives to make data-driven decisions that drive growth and optimize performance.
Design Principles
The design of the platform was guided by three core principles:
User-Centered Design: Intuitive interfaces and seamless navigation ensure that users can access insights quickly and easily.
Visual Clarity: Consistent color coding and visually engaging charts highlight key trends and outliers.
Scalability: The platform is designed to scale with the organization, supporting additional data sources and user groups as needed.
Color Coding and Design Language
Green: Indicates performance above target.
Yellow: Signals areas requiring attention.
Red: Highlights critical performance gaps.
Neutral Grey: Represents non-actionable data points, maintaining focus on key metrics.
Data Architecture
The platform integrates data from multiple systems, ensuring accurate and timely insights:
Data Sources: CADRE for sales estimates, Lotus Notes for proposal and Customer information, SAP for financial information, and Excel for manual adjustments.
ETL Process: Automated ETL pipelines extract, transform, and load data into the BI platform, ensuring data accuracy and consistency.
Data Refresh Rates: Daily data refresh ensures that users have access to the latest information.
Data Structure and Relationships
Single Source of Truth: The platform integrates data from Bidding Tool, SAP, Lotus Notes, and SHAPE (Global SAP system) into a centralized data warehouse.
Organizational Norms (ON): Data logic follows standard organizational KPIs and calculation methodologies to ensure consistency.
ETL Process: Automated Extract-Transform-Load (ETL) pipelines clean and normalize data before loading it into the BI platform.
Table Relationships:
Sales Rep IDandDistrict IDestablish relationships between performance data and organizational hierarchy.Work Order IDconnects service performance metrics with financial data.Booking Amount,Labor Hours, andRevenueare aggregated at daily, monthly, and quarterly levels for trend analysis.
Impact and Results
The implementation of the Portfolio Insights & Performance Analytics Platform has delivered measurable improvements across the organization:
Increased Sales Performance: Sales teams now have real-time insights into their performance, enabling proactive course corrections.
Enhanced Decision-Making: District managers can quickly identify performance gaps and address them before they impact revenue.
Operational Efficiency: Automated reporting has eliminated manual processes, saving time and reducing errors.
Data-Driven Culture: The platform has fostered a culture of data-driven decision-making, aligning sales and operations with organizational goals.
This project highlights my ability to design and lead sophisticated BI solutions that deliver real business value. This platform is a testament to my expertise in Business Intelligence (BI) & Reporting, Business Process Integration (BPiM), and , Product Management and I am excited to bring this level of innovation to future projects.
Field Name | Description | Source System | Data Type | Logic/Transformation |
|---|---|---|---|---|
Sales Rep ID | Unique identifier for each sales representative | Bidding Tool | Integer | Used as a primary key for sales performance tracking |
District ID | Identifier for each sales district | Bidding Tool | Integer | Used to aggregate data at the district level |
Booking Amount | Total value of sales bookings | Lotus Notes | Currency | Summation of bookings YTD |
Bookings-to-Plan (%) | Percentage of actual bookings against planned targets | Bidding Tool, Lotus Notes | Percentage |
|
Proposal Success Rate (%) | Ratio of successful sales proposals to total proposals | Bidding Tool | Percentage |
|
Churn Rate (%) | Percentage of customers who canceled services | SAP | Percentage |
|
Labor Hours (Actual) | Total hours worked by field technicians | SAP | Decimal | Aggregated at the monthly level |
Labor Efficiency (%) | Productivity measure comparing actual hours to planned hours | SAP | Percentage |
|
Revenue by Product Line | Revenue generated from each product/service category | Lotus Notes | Currency | Aggregated at product line level |
Bid Performance (%) | Ratio of bids won to total bids submitted | Bidding Tool, Lotus Notes | Percentage |
|
Overruns ($) | Total cost overruns for completed jobs | SAP | Currency | Sum of cost overruns YTD |
Competitor Loss Analysis | Number of lost deals with reasons specified | SHAPE | Integer | Categorized by loss reason |
Sweet Spot Analysis (Units) | Optimal number of units for maximizing profitability | Bidding Tool | Integer | Calculated based on historical performance |
Work Order ID | Unique identifier for each service work order | SAP | Integer | Used for detailed drill-down analysis |
Refresh Rate | Frequency of data refresh for real-time insights | ETL Process | Timestamp | Daily refresh scheduled at midnight |
More Works
FAQ
What's your approach to turning complex business challenges into actionable solutions?
How do you balance innovation with practical implementation?
How do you ensure cross-functional alignment in large-scale projects?
What's your strategy for driving data-informed decision making?
How do you approach change management in global teams?
How do you measure and communicate the impact of your initiatives?
How do you balance technical solutions with business needs?
What's your philosophy on continuous improvement and learning?